Course Contents
Introduction
Introduction
Important Introduction to Udemy and Where to Ask A Question
SQL
The Data Analyst Role
Downloading MySQL Workbench - Please Read
Download MySQL Workbench - Windows
Download MySQL Workbench - MacOS
MySQL Workbench Overview
What is SQL & Data Definition Language (DDL)
Insert Data Into a Table
Create Classic Models Schema
What is a Relational Database?
Want to Complete a Relational Database Project?
A note on the SQL section
Select, From & Where Statement
Select Statement Q & A
Upper & Lower
In & Not In
Show all columns for customers who are from New York, London or Mumbai using IN
Distinct, Like & Order By
Examples of Distinct and Like
Inner Join
Left & Right Join
Example and Use Case of Joins
Joins Q & A
Show all customers and their orders, even if they made no orders. Both tables have a cust_code field
Union & Union All
Show all Employees and Customers
Joins and Union
Sum, Round, Group by & Having
Show the sum of all orders on each day
Count, Max, Min, Avg
Count how many distinct customers there were on each day
Aggregate Functions Q & A
Subquery
Common Table Expression (CTE)
Case statement
Create a Flag using Case Statement
Examples of Case Statement
Quiz - Case Statement, Sub Query and CTE
Row Number
Lead & Lag
Row_Number and Lead/Lag
Row Number Q & A
Date Functions
String Functions
Date and String Functions
Introduction to Statistics for Data Analysis
Central Tendency: Understanding Mean, Median, and Mode
Exploring Range with a Practical Example
Understanding Variance and Standard Deviation
Understanding Frequency Distribution
Quantitative and Qualitive Variables
Excel with Netflix Dataset
Download Excel and Netflix Dataset
Common Excel Shortcuts
Split Text to Columns - Part 1
Split Text to Columns - Part 2
Trim & Separate Data
Sort & Filter Data
Common Calculations - Sum, Avg, Max, Min
If Function
Sumifs & Countifs
Unique, Left, Right
Vlookup
Pivot Tables
Excel - Exercises and Answers
Separate Sheets and Find & Replace Blanks
Import Netflix Data to MySQL Workbench
Set Up Relational Tables for Power BI
Power BI Dashboard: Netflix - Windows Users only
Please Read if You're Starting Course Here
Are you Having Issues Downloading a Connector to MySQL?
Download Power BI and Connect to Data
Power BI Overview
Create Area Chart
Create Shows by Rating & Top 10 Categories Charts
Create Countries Available Map and import Netflix logo
Create Single Title View Page - Part 1
Create Single Title View Page - Part 2
Classic Models Data Analysis Exercises
About this Section
Sales Overview by Product
Sales Overview by Country
Products Purchased Together
Customers' Sales Value by Credit Limit
Sales Value Change from Previous Order
Office Sales by Customer Country
Customers Affected by Late Shipping
Advanced Exercise - Customers who go over Credit Limit Part 1
Advanced Exercise - Customers who go over Credit Limit Part 2
Using ChatGPT as your SQL Coding Assistant
Introduction to Prompt Engineering
Using ChatGPT to extract Sales by Product and Country
Attempting Intermediate and Advanced SQL Queries with ChatGPT
Grouping Data with ChatGPT and SQL
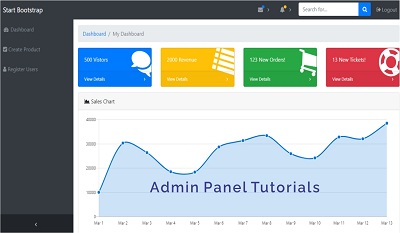
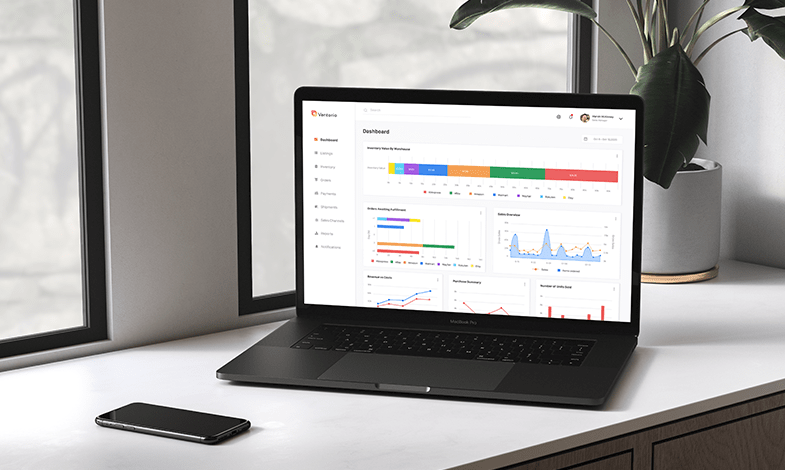
Power BI Dashboard: Classic Models - Windows Users only
Dashboard Planning Session with Head of Sales Operations
Create View in My SQL Workbench for Power BI
Connecting to Power BI Data Source
Connect Power BI to Data Source & Prepare Canvas
Create Overview Cards
Create Overview Line Charts
Set up Measures for Sales & Net Profit Buttons
Add Actions to Buttons and Create Bar Chart
Create Scatter, Column & Donut Charts
Add Conditional titles to Charts
Create Decomposition Tree
Create Sales Overview Table with MoM % and YTD Calculations
Add Filters and Page Navigation Buttons
Electric Vehicle Dashboard with Tableau
Download Tableau Public and Electric Vehicle Dataset
Tableau Overview
Create Bar Chart - Vehicle Year
Create Map
Top 10 Counties Column Chart
Make & Model Column Chart and Parameter
Create Donut Chart
Put Dashboard Together
Format and Publish Dashboard
Bike Sales Dashboard with Tableau
Connect Tableau to our dataset
Top 10 Products chart
Stacked Bar Chart showing Profit by Sub Category
Bubble Chart showing Revenue by Age Group
Map showing Profit by Country
Profit and Year on Year % Change Cards, and Year Parameter
Revenue Card and Line Chart
Product Category Cost card
Put Dashboard Together - Part One
Put Dashboard Together - Part Two
Congratulations and Thank You!
Congratulations and Thank You - What you can do now
Appendix - Relational Database Project (Optional)
Introduction to Relational Databases: Understanding the Basics
Normalization Explained: First Normal Form (1NF)
Achieving Second Normal Form (2NF): Part 1
Achieving Second Normal Form (2NF): Part 2
Third Normal Form (3NF): Ensuring Data Integrity
Designing an ER Diagram - Part 1
Designing an ER Diagram - Part 2